


How can BIPV be visually assessed?
Visual assessment is necessary to quantify how well photovoltaic modules are visually integrated in a building or environment. Novel methods and tools were developed to assess three main criteria: saliency, reflection and color.
Saliency
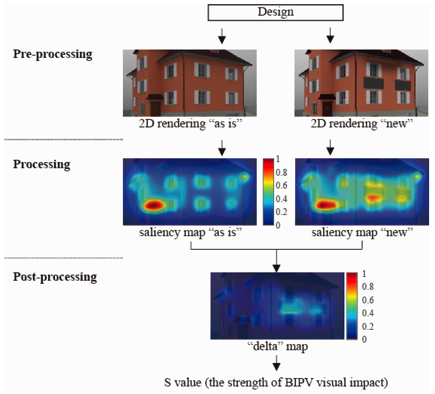
The saliency method is a tool used in computer graphics to prioritize areas of visual attention in 2D images for image compression algorithms or in 3D models for level of detail in modeling. We analyzed several saliency models and transferred the Graph Based Visual Saliency for the first time into the BIPV context, for which several modifications were developed and applied in case studies [1]. The images in Fig. 1 shows a simplified workflow. Based on two images (existing design and proposed new design with BIPV), the modified saliency method computed the visual difference into a delta map, quantifying the visual impact. This visual impact can be related to regulations, e.g. allowing higher impact in industrial areas, and mandating lowest impact for heritage areas [2].
Reflection
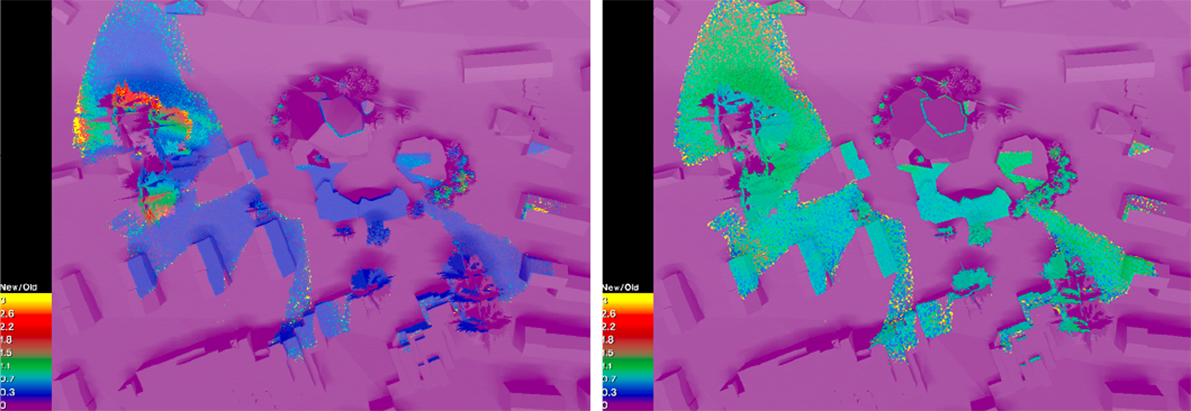
The novel computational simulation is based on forward raytracing of sun rays obtained from hourly simulations using weather data, and detailed data obtained from goniophotometric reflection measurements of different BIPV glass properties [3]. Like in the saliency method, the original and proposed state were modeled in 3D as a base for relative comparison. Here the accumulated irradiance "before" and "after" were compared and expressed as false color renderings. The images in Fig. 2, for example, indicate which areas of the site plan are subject to the most increase in irradiance and thus may yield a glare problem (image left). Further simulations using different glass surface properties showed that the glare probability within this area can be reduced to an acceptable level (image right).
Color
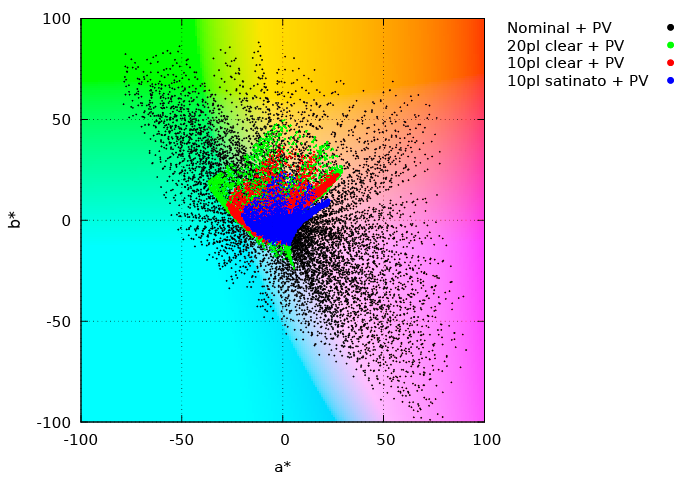
The novel color assessment method is again a relative assessment, this time between a specified color and the perceived color, when PV glass is printed digitally with ceramic ink. Two corresponding images were compared and their color differences were computed according to CIE standards. The difference was validated through experiments with humans [4]. In a second step, more than 1,000 colors were specified, printed on glass and assembled as colored PV modules. Using the above method, the color gamut of the specified and perceived colors was compared. The black dots in Fig. 3 show the color coordinates of the specified colors, while the other dots show the corresponding coordinates of the perceived colors when printed on clear and opaque glass with different amount (pl) of ceramic ink, indicating reduced color gamut of digitally-printed colored PV modules [5].