4.4 Market Adoption of BIPV

What is the profitability of a BIPV installation?

Because economic performance is a predominant factor in the intention to install BIPV, financial analysis of a retrofit project incorporating BIPV can help overcome certain preconceived ideas that represent barriers to the deployment of large-scale solar energy.

This sheet proposes an in-depth study of the whole life-cycle cost (LCC) analysis of the renovation project with BIPV installation on an archetype built in the 70s [cf sheet 2.2]. Payback time as well as internal rate of return are calculated for different intervention strategies at the building level and different energy-use scenarios.
 
Keywords: Installation cost; Payback time; Internal rate of return; Storage strategy; Self-consumption.
Target audience: Regulation makers; Owners & other decision makers; Architects & engineers; Suppliers & companies; Broader public.

Fig. 1 (left) Estimation of the simple payback time (SPBT) for each renovation scenario, taking into account the energy-use variants A) 100% of potentially active surfaces, B) selected surfaces and C) batteries, and changing out the existing oil-boiler for an electric heat pump [1] (©EPFL-LAST). Fig. 2 (right) Internal rate of return (IRR) with 35-year horizon of each renovation scenario, taking into account the energy-use variants A) 100% of potentially active surfaces, B) selected surfaces and C) batteries, and changing out the existing oil-boiler for an electric heat pump [1] (©EPFL-LAST).

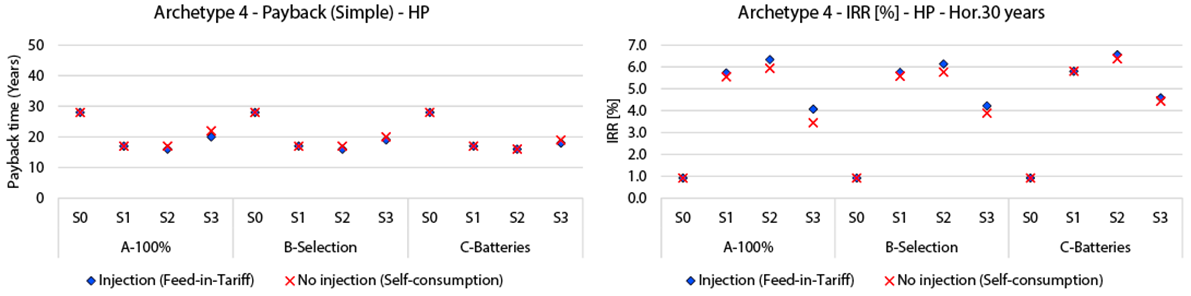
Fig. 1 and 2 present the results of the life-cycle cost (LCC) analysis regarding the whole renovation project, including BIPV strategies and the replacement of the existing oil-boiler by an electric heat pump. In addition, we propose three comparative energy-use scenarios related to the sizing of the BIPV installation and the implementation of storage systems. 

  • A-100% takes into account the activation of 100% of the possible surfaces detected during the implementation of each renovation scenario [cf sheet 2.3]
  • B-Selection takes into account only those active surfaces that allow an equilibrium between self-consumption and self-sufficiency, resulting in an installation that is better adapted to the demand of the building. The rest of the possible active surfaces will present the same visually but without PV cells. 
  • C-Batteries takes into account the selection from scenario B, to which a battery system is added, in order to increase self-consumption and self-sufficiency potential. 

Simple payback time (SPBT): number of years necessary to recover the investment cost taking into account as income the annual energy saving cost. Internal rate of return (IRR): interest rate (or discounted rate) that gives a net present value (NPV) of zero. Equivalent to the minimum interest rate that is needed to receive in an alternative investment to equalize the investment in the renovation.

Fig. 3 (left) Parametrization of the photovoltaic BIPV / BAPV installation balance of system (BOS) cost. Prices include all components of the installation (PV panels, junction box, connections, cabling and inverters) [1-4] (©EPFL-LAST). Fig. 4 (right) annual O&M (operational and maintenance) cost . Prices include all components of the installation (PV panels, junction box, connections, cabling and inverters) [1-4] (©EPFL-LAST).

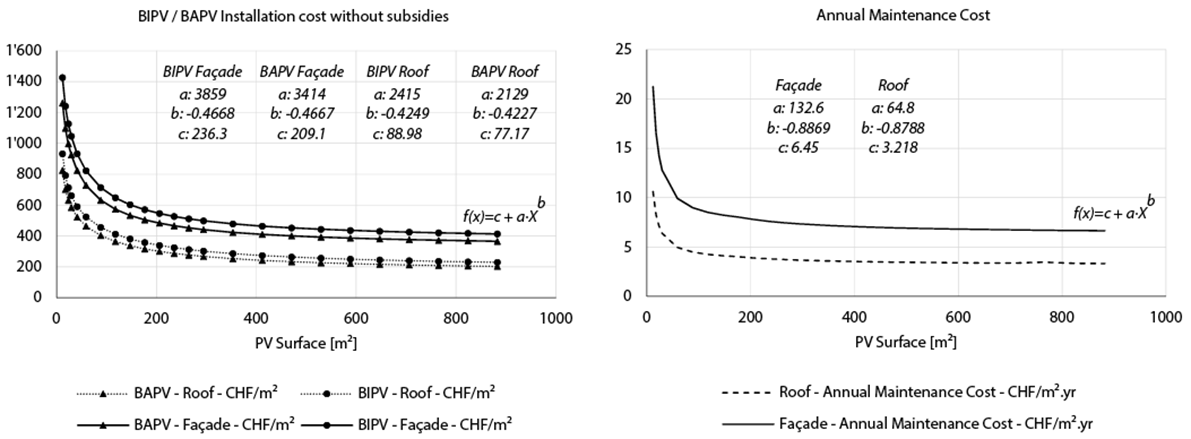
The cost of the BIPV installation is based on the market study conducted by OFEN in 2016 [2] and the web tool [3]. This data was treated in order to obtain a series of curves (Fig. 3) allowing to use the cost value parametrically in function of the active surface selected. The cost includes all installation components (PV panels, junction box, connections, cabling and inverters).

Fig. 1 shows that the three BIPV renovation scenarios have a shorter PBT compared to the one obtained for the shallow renovation of scenario S0 (about 35 years), which corresponds to current practice with the objective of complying with the minimal legal requirements defined by SIA 380/1:2016 [5]. All values for BIPV scenarios S1, S2 and S3 achieve a PBT below 25 years, making this investment very attractive.
 
In terms of cost-effectiveness, the IRR obtained for the BIPV scenarios (using a 35-year horizon) is higher than 3% in all cases and achieving 5% in some scenarios. These results convey a key message: not only could BIPV strategies help achieve environmental targets for 2050 [6], but BIPV could also help promote the renovation process.
References

[1] S. Aguacil, E. Rey (dir), Architectural Design Strategies for Building-Integrated Photovoltaics (BIPV) in Residential Building Renovation. EPFL Thesis n°9332, 2019.
[2] OFEN, Photovoltaïque : observations du marché 2016, 2016.
[3] OFEN, MétéoSuisse, Swisstopo, Solar potential, roof and facade (web tool), 2018. http://www.uvek-gis.admin.ch/BFE/sonnendach/?lang=fr (accessed March 3, 2018).
[4] Suisse Energie, Coûts d ’exploitation des installations photovoltaïques, 2017.
[5] SIA, SIA 380/1:2016 - Besoin de chaleur pour le chauffage, 2016.
[6] SIA, SIA 2040:2017 “La voie SIA vers l’efficacité énergétique,” 2017.
 
Contact person
Sergi Aguacil | EPFL-LAST | sergi.aguacil@epfl.ch

PDF