What is the energy performance of BIPV at component level?
In order to untangle some misconceptions about the environmental impact of BIPV, here we illustrate how energy and carbon payback times are well below the module’s expected lifetime.

In choosing to implement scenario S3–Transformation [cf sheet 2.3], our objective and strategy were:
- To obtain highest energy performance and electricity production possible;
- To assess the building’s potential; and
- To ensure aesthetic and formal coherence of the building as a whole (reference target performance: 2,000-Watt Society concept according to SIA 2040:2018 for operational energy consumption and construction materials).
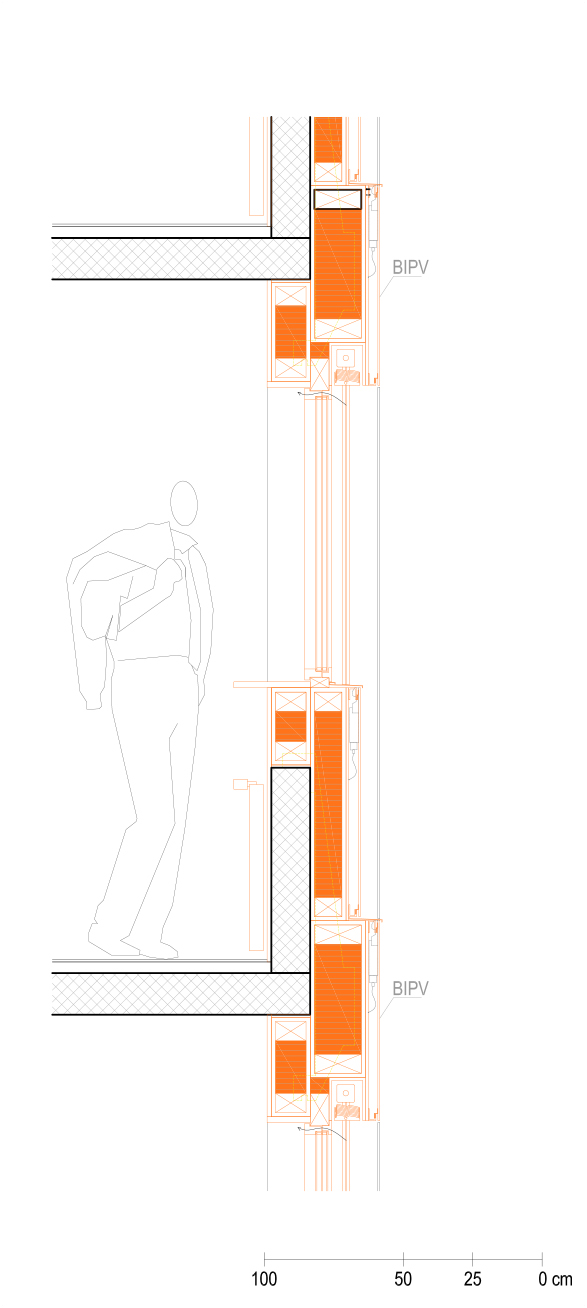
- Frameless PV panels with mono-Si cell technology (with an efficiency of 18% in STC);
- Size customization respecting manufacturers’ recommendations for glass/glass modules (length 50-3800 mm, width 50-2400 mm) using 6” standard size solar cells [2];
- Visual customization (dark gray colored film)
- Final performance estimation about 14.5% in STC.

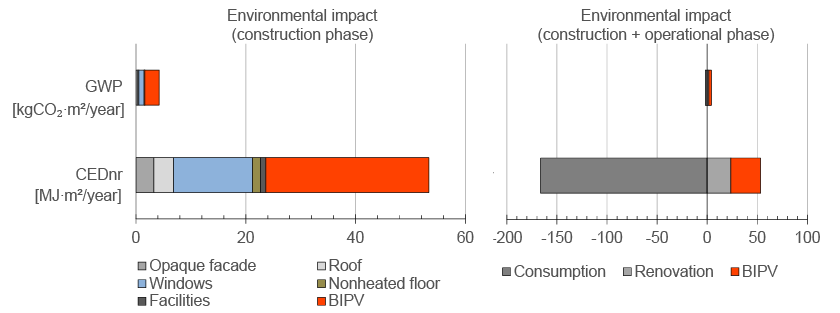
In the chart on the left in Fig. 2, we show the environmental impact during construction of the different components of the whole renovation project in scenario S3, Archetype 4, based on data from KBOB 2016 [3]. In the chart on the right, we show the global environmental impact considering both construction (materials) and operation (energy consumption) phases.
In terms of photovoltaic performance, the price of the electricity produced is 6.2 to 8.6 cts/kWh, much lower compared to the standard price of electricity from the grid, about 20-25 cts/kWh.


